Home
Home
 May 18, 2021
Complete Guide To Survey Data Analysis using AI
Survey data analysis is one of the most insightful methods of discovering customer insights. After all, in a fast-paced competitive business world, customer feedback surveys are integral to a robust marketing strategy. Explore how Repustate’s AI-powered sentiment analysis API makes evaluating survey results easy, fast, and more accurate. We will also see how survey result analysis is done semantically, as well as the top survey apps for the voice of the customer (VoC) and voice of the employee (VoE) data.
What are the major challenges in survey data analysis?
Major challenges begin with an incorrect goal setting and inaccurate target audience. Add to this, human prejudices, wrong sample size, non-conducive interview methods, and the problem of verbose responses to open-ended questions. All these pose a hurdle in efficient survey result analysis. We examine them in detail below.
- Goal setting:
Establishing accurate goals. You have to ensure that your goals are aligned across teams and are in tune with what the end objective of your marketing department is. Goals can be searching for a potential market for a new product or service, customer and patient feedback, employee satisfaction, or to get a perspective of the company’s brand image, products, services, etc. Therefore, goal setting is a vital first step before you decide on how to analyze survey data.
- Right target audience:
Determining the right target audience (TA) is critical to correct survey data analysis. If the survey is about employee satisfaction or patient voice, the TA is fairly obvious. But when it comes to establishing the right audience for a new product or service, the TA can be less obvious and so interviewing the right demographic is critical to meet your goals.
- Human bias:
It is important to address human bias when establishing how to analyze survey data. Bias can creep in when human intervention is used for survey result analysis. For example, the surveyor may be biased against ex-employees and ex-candidates. So can they be biased against ex-customers or even people who phone-in or send survey results voluntarily, assuming that they are more heavily invested and therefore have stronger opinions that may not be accurate. Having an AI-based automated model that reads and interprets data analysis of survey results can overcome this hurdle.
- Sample size & quota:
It is very important that the survey represents a large sample size, which includes sub-groups in the target audience. It is vital to establish the right quotas because the accuracy of the survey depends on this heavily. For example, men and women may have different opinions, while older adults may not have the same opinions as your middle-aged audience. To accurately reflect the general population’s opinions, the survey needs to ensure that the percentage of all relevant sub-groups reflects their percentages in the current market share of the region the survey is being conducted in.
- Interview methods:
The main challenge in conducting any kind of survey usually comes down to what method would be best in capturing the data from the target population. While online surveys seem to be the easiest to do, it may have to be kept in mind that internet surveys are not always reliable, nor ubiquitous in many regions as well as user-friendly to different sub-groups. Therefore, a mix of online and offline methodologies needs to be used for surveys.
- Smartphones & tablets:
Surveys must be conducted using responsive design survey software for adaptability on mobile devices and tablets as this affects survey quality to a great extent. This means that the surveys should be able to adapt to different devices, in terms of fonts, labels, images, and text input. Some survey software can also let you use branching instructions to present different versions of questions on smartphones and laptops. A paper published in the Oxford Academics Journal illustrates this point in more detail.
- Open-ended questions:
The problem with having open-ended questions in surveys is that they do not have pre-determined answers that can be used to rate an outcome. Open-ended answers may be in various forms - some short and to the point, while some may express many opinions about different facets of the product or business. While a rating method can help predict outcomes through semantics, open-ended questions need a sentiment analysis solution that can make sense of the responses and accurately measure the outcome.
How is survey result analysis done with Semantics?
Survey result analysis done with semantics is based on survey response patterns that can be predicted by an AI-powered natural language processing (NLP) algorithm. The model does so by using information that is available and predetermined before conducting the survey.
This pre-existing or pre-collated data (corpus) may be in the form of phrases, texts, topics, aspects, and features that have already been collected in relation to the subject of the survey. This information can be gathered in different languages, depending on how many languages the survey is going to be sent in.
Using latent variables to dig deeper
In the context of surveys, a latent variable is an unmeasurable variable that can influence the responses to a number of other aspects of the subject in the questionnaire. An unmeasured variable is one where there is no simple quantitative measure of a “yes” or a “no”. The degree of accuracy of arriving at a deeper level of answer depends on how many more related questions one can ask about the subject. That’s why in a survey, sometimes one will find several questions related to the same topic. Quantitative datasets are extremely relevant but so are qualitative ones.It may seem redundant to the respondent, but for data scientists all the questions are equally important to arrive at a satisfactory conclusion. For example, when we are trying to find out about a customer’s satisfaction with a certain product, there will be multiple related questions asking about their experience at different junctures of the sales cycle. No one item may encapsulate the full latent variable i.e. customer satisfaction in this case, and so “satisfaction” is viewed as a latent variable. As a rule, market research and industry surveys are longer than polls and entertainment surveys.
Semantic overlaps of latent variables
Data scientists understand how these variables are related and that survey scores can contradict each other in many different ways. At other times, these answers to latent variables may have patterns emerging. These can throw light on an issue in a more thorough manner because of semantic overlap amongst the various data items. This is often illustrated when a rating methodology is used in survey data analysis. Let us expand this point a bit more.
The Rensis Likert method:
Most surveys use a rating method introduced by Rensis Likert where respondents rate a statement on a scale from “strongly approve” to “strongly disapprove”. AI algorithms use this rating method to semantically score survey data and predict answers depending on what answer the survey respondent has chosen. To understand this, let’s take an example. It cannot be ascertained in advance what a respondent will rate an item that says “I like this hospital”. But once the respondent rates the item as “very likely”, he or she may have the same semantic probability score to endorse “I do not want to change my healthcare provider”. This type of semantic scoring helps an AI algorithm to predict what the likelihood of a person’s answer will be to semantically linear questions.
Semantic similarity in action
The video below demonstrates a live example of how semantics is used in survey result analysis. Repustate’s survey analysis tool uses NLP and machine learning to understand the semantic similarity in texts, and in multiple languages. This means even if your respondent answers in a different language than the language the survey is in, it can still decipher the intent of the response in an open-ended survey. Watch the video to see how.
Thus, semantics is a very important component of automated survey data analysis. However, as a caution, it is essential to have a capping of the semantic linking of items in survey-based research because if semantic overlap continues across scales, it can contaminate the data.
What are the benefits of survey analytics with sentiment analysis?
Survey analytics with sentiment analysis can give a more detailed and holistic view of the reasons behind consumer behavior. Through sentiment scoring and data analysis of survey results, a company can take focussed, corrective measures for product & service enhancement, as well as operational efficiency.
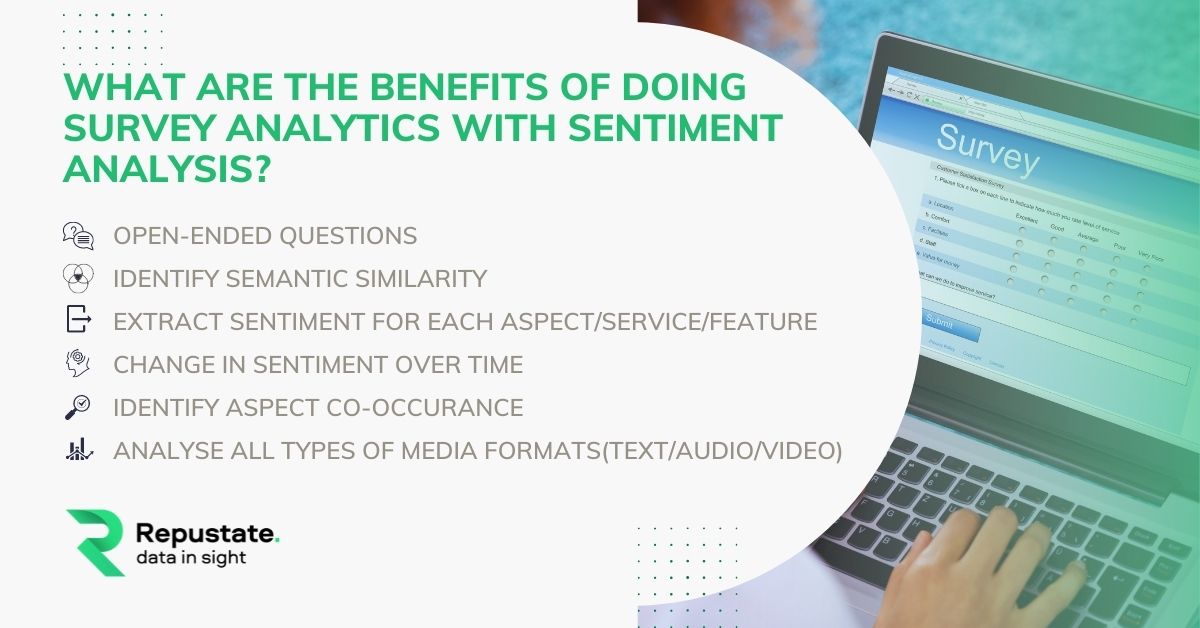
Sentiment analysis in survey analytics can help businesses:
- Understand open-ended questions
- Identify semantic similarity
- Extract sentiment for each aspect/service/feature
- Change in sentiment over time
- Identify aspect co-occurrence
- Analyse all types of media formats (text/audio/video)
Let’s understand how
To find answers that can offer this kind of depth, surveys need to have open-ended questions, whatever format they may be in. They can be gathered through video interviews, chats, telephone calls, online forms, survey mails, and other methods.
An ideal survey result analysis software will ensure that all open-ended answers are categorized and analysed for accurate results using rigorous text and audio content analysis. It will also decipher data collected from video channels such as those used in candidate interviews, patient voice, or employee satisfaction surveys through video content analysis.
These answers when run through NLP algorithms can be analysed for recurring topics, aspect co-occurrences, themes, etc so they can be eventually processed for sentiment analysis. The model will also identify semantic similarity amongst latent variables, Sentiment analysis of open-ended responses thus collected and aggregated can help a company understand qualitative measurements by allowing the respondent to elaborate on the ‘why” behind their answers.
Consider this example “The coffee is great. But is it worth it, considering I have to wait so long just for a cuppa? Perhaps if there was a separate counter just for coffee and another for breakfast order."
In this example of an open-ended response to a question, it is clear that it cannot be analysed without manual intervention or running it through a text analytics tool. This is because there is no predetermined category that the answer can be categorised in. With sentiment analysis, it can be predicted that the respondent likes the coffee, but the long waiting time can prompt them to take their business elsewhere. Along with the compliment (coffee is great) and complaint (long wait-time), the respondent also gives a solution to the problem (separate lanes for coffee, and breakfast orders).
In this manner, the sentiment mining solution can extract sentiment for each aspect, service or feature. As it analyses different surveys, it stores information as well and when required, can throw light on change in sentiment that has occurred over time.
Responses like these are very valuable to a business, especially when collected and analysed at scale, as they can easily find cures to falling customer appeal. And therefore, survey analytics when done with sentiment analysis, can reap huge dividends for a company.
Top survey apps for VOC and VOE
An ideal survey app should offer data security, customization, client onboarding tools, as well as integration with various CRM systems like SalesForce. The software should also be able to create and broadcast the surveys swiftly and easily. Here are some top survey analysis platforms that cover all these areas and are apt for voice the customer (VoC) and voice of the employee (VoE) data in terms of scalability, features, and technology.
Survey Monkey handles 20 million questions daily. It is robust and can help you scale easily. It has a secure survey platform and can merge survey insights into your business and customer relationship management (CRM) apps through built-in integration and plug-in features.
Qualtrics is a comprehensive research platform that can help you gather customer feedback throughout the new product development phase. You can capitalize on key business differentiators and identify gaps in products and services.
Google Surveys is a popular platform for data analysis of survey results. It offers data analysis through simple in-built graphs and charts, and is apt for mid-sized companies as well as large enterprises.
GetFeedback helps you measure the VoC and can easily integrate with your Salesforce customer data. You can send surveys through email, chat, or SMS. It is used by more than 1, 700 companies.
Explorance allows you to send surveys and has a 360-degree feedback mechanism. It is suitable for VoE and academic experience programs. It can be used simultaneously across teams with the use of single sign-on (SSO) access to unify the experience for other survey creators.
Read this article for a more in-depth view of these Top 5 Apps.
Repustate’s sentiment analysis tool for survey data
Only when you can discover insights through sentiment scores, can you use it for competitive analysis, brand insights, and business intelligence. That’s why along with quality survey data, it is of utmost importance to choose the right sentiment analysis solution to understand the nuances in open-ended questions that may initially seem like incoherent ramblings to the untrained eye.
Repustate’s sentiment analysis solution for survey data analysis understands the semantic relationship between texts and phrases, in 27 different languages and dialects. You can analyse your data as in-depth as you want. You can resort to a simple topic-based sentiment analysis solution or decide to go deeper and conduct an aspect-based sentiment analysis for a more holistic view for brand intelligence.
With an accuracy score that is beyond our competitors’ on the Magic Quadrant, Repustate’s sentiment analysis solution can help you conduct a gap analysis of your product and service offerings. It can help you with data-backed insightful recommendations with a resourceful visualization dashboard that can present the data in a more coherent format.
 Jeremy Wemple
 Dr. Ayman Abdelazem
 Dr. Salah Alnajem, PhD
 David Allen

 Repustate Team