Home
Home
 Apr 7, 2021
Top 10 Customer Insights Dashboards for Sentiment Analysis
Customer insights dashboards give an intelligent view of consumer sentiment analysis data in the form of charts and graphs that a company can use for better decision-making. With these visualization tools, you can see perspectives gained from different data sources in one intuitive screen. Dashboards help companies strategize data-backed business tactics to steer consumer behavior, employee morale, and brand reputation. In this article, we discuss such top customer insights dashboards; what makes Repustate’s sentiment analysis dashboard so brilliant; and the challenges in managing consumer insights data.
What are the challenges in managing consumer insights data?
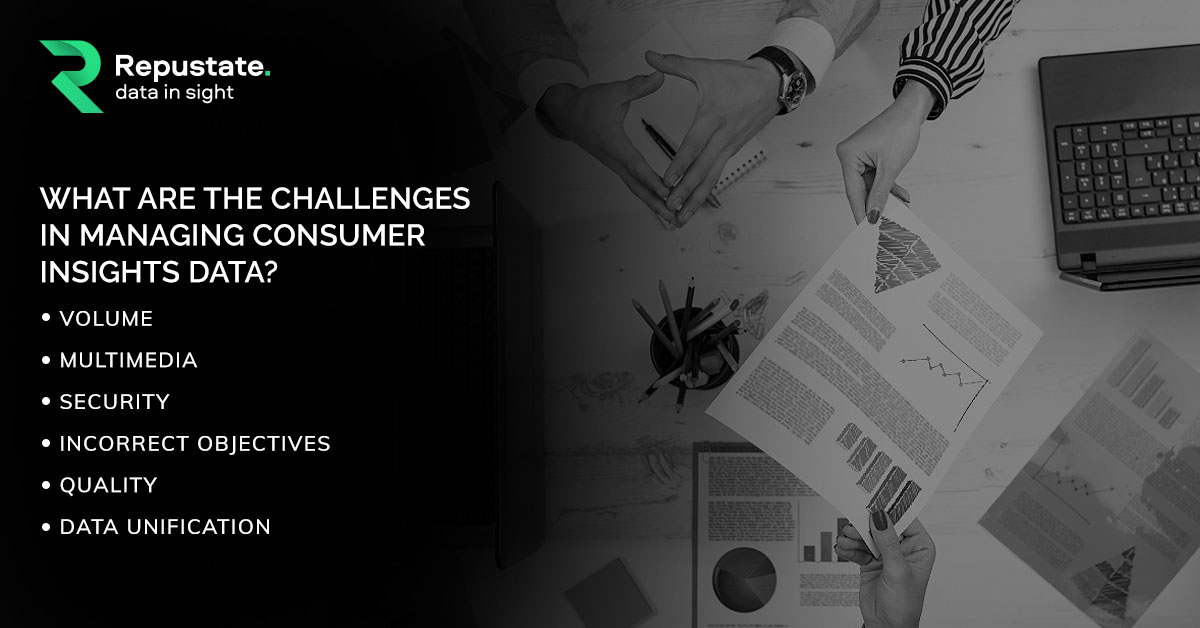 Consumer insights are a goldmine for business intelligence. There are, however, challenges in managing this data because of size, security, quality, and other issues. Let’s look at some of them:
- Volume
The sheer volume of the continuously accumulating data can be difficult to manage. Data from surveys, Voice of the Customer, Voice of the Employee, social media listening, and corporate sales & marketing collaterals, etc. can be gigantic and needs to be first semantically organized for text analytics.
- Multimedia
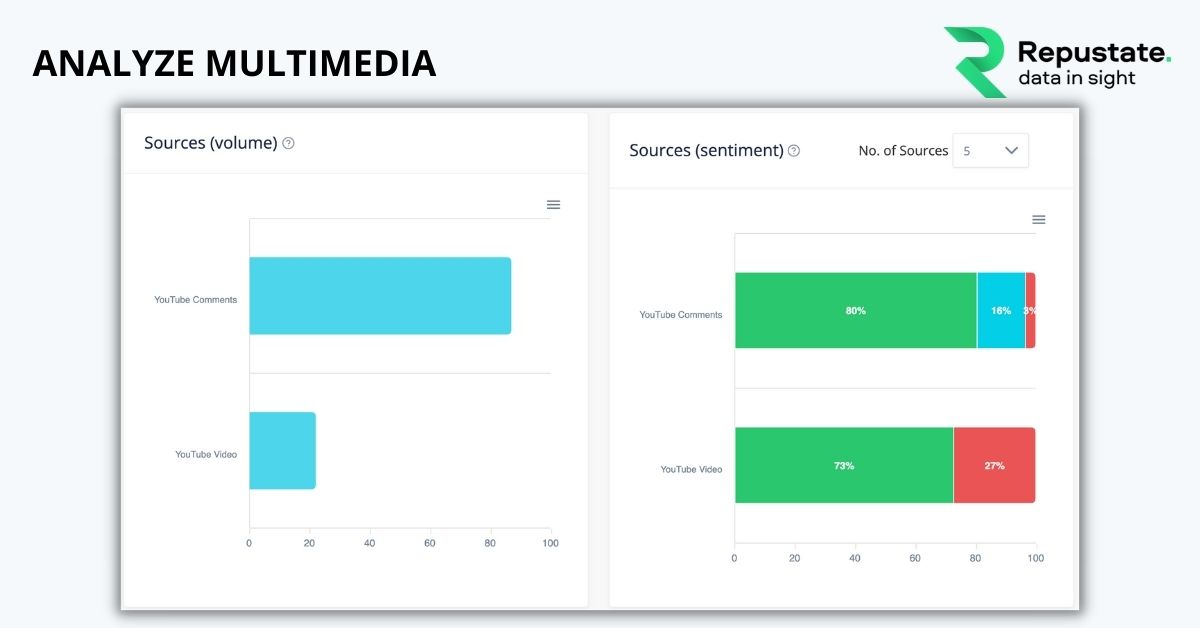
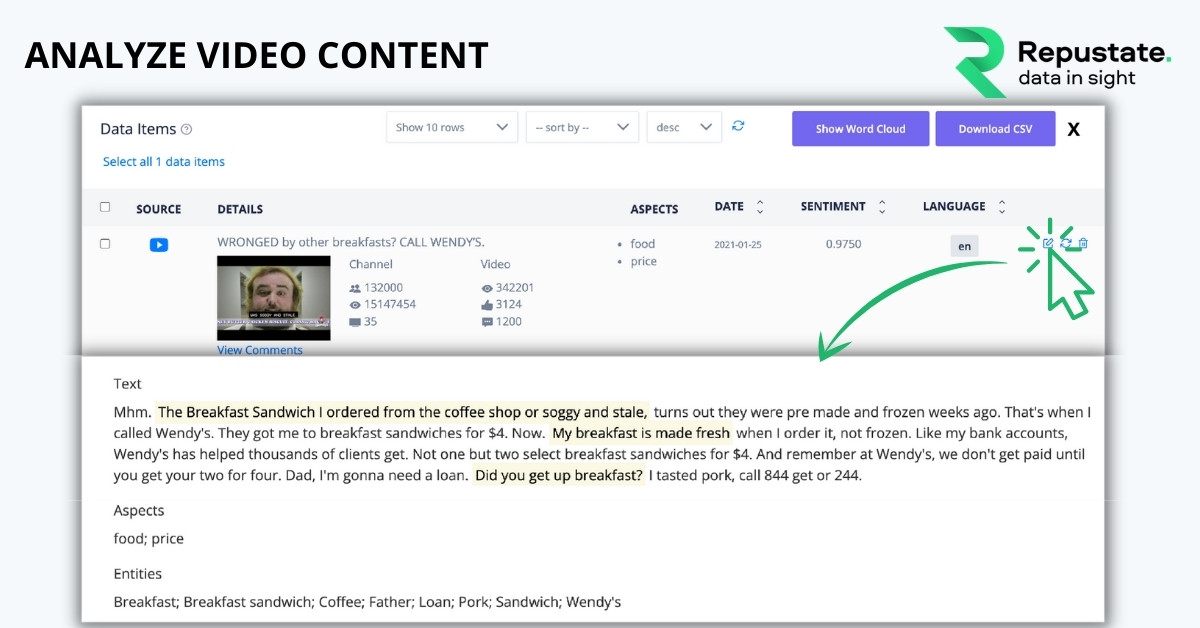
Data can be in different formats such as audio, text, images, and video. Ensuring that all of it is ready for text analytics and video content analysis is a core necessity for accurate and holistic sentiment scoring.
- Security
A breach in data security can be detrimental to a company’s business and its brand reputation. Not to mention the slew of lawsuits that can follow. Therefore, data security always needs to be on high priority.
- Incorrect objectives
Incorrect objectives mean useless data. Many times, a company wants to know the sentiment scores of its brands without asking for the reason behind the sentiment. Such data when analyzed cannot bring any long-lasting impact to a business.
- Quality
Quality control within the data gathering system can weed out unnecessary noise and help in getting more accurate sentiment analysis. Data scientists need to evaluate the quality of answers in surveys on an ongoing basis, to ensure that the questionnaires are productive.
- Data unification
Many companies store information in different sources spread across the organization. This is because departments in large organizations tend to work in silos. To get a truly holistic view, all this data needs to be unified.
What are the benefits of having a customer insights dashboard?
Granular text analytics and sentiment mining of customer data, enabled through named entity recognition, gives rich insights for business strategies. This intelligence is made clear and easy to understand through a customer insights dashboard. With an intuitive visualization tool, companies can benefit from:
-
Real-time consumer sentiment monitoring
-
Data-backed decision-making
-
Insight-sharing capabilities
-
Better actionable insights
-
Improved data management
-
Time and resource optimization
-
Cost-effectiveness
Repustate’s Sentiment Analysis Dashboard
Repustate’s customer insights dashboard is designed to give you powerful insights keeping in mind contextual information, data security, user-friendliness, and the target audience. Our clients, worldwide, use our dashboard for crucial business intelligence across verticals such as healthcare, hospitality, education, and luxury accessories.
Key benchmarks of Repustate’s sentiment analysis dashboard:
- Targeted insights
The Repustate dashboard is created to serve targeted audiences based on their unique profile. You don’t have to be a data engineer to understand what your customers are trying to tell you. Whether you are a CTO or Digital Marketing Manager, the tool provides you the insights that you can use.
- Contextual Information
Repustate’s customer insights dashboard gives true insights because it showcases results that are received through a frame of context attached to data. With contextual information, you get a deeper perspective on key metrics for historical comparisons and industry benchmarks. Watch this video to see how context in data for sentiment analysis gives you more accurate results.
- Defined metrics
A great visualization tool makes metrics easy to understand. It is built to serve users with different levels of domain literacy. That’s why Repustate’s sentiment analysis dashboard makes sure that the data is easy to grasp with the help of simple charts and graphs.
- Intelligent design
A dashboard needs to have a logical visual hierarchy that helps in exploring the insights. Repustate’s dashboard is built intelligently, keeping in mind the end-user’s thought process while navigating the content. The dashboard allows you to access information across various key performance indicators and filter through the insights.
- User friendly
There is no point in a dashboard that is all-encompassing but complicated to use. Repustate’s sentiment analysis dashboard provides you with a user-friendly interface that gives actionable data insights tied to your daily objectives and goals.
- Data Security
Your data is always safe with Repustate’s Cloud-based visualization tool because it is also available as an on-premise solution. By being behind your firewall, your data is safe from security breaches, and you face no downtime because of its simple plug-and-play ability.
Respustate’s Sentiment Analysis Dashboard allows you to track:
- General sentiment overview
- Aspect-based sentiment breakdown
- Aspect occurrence frequency rates
- Named entities, classifications, and entity frequency
- Toggle between aspect sentiment and text chunks
- Set alerts and get notifications in real-time
- Changes in sentiment over time
- Changes in aspect sentiment over time
- Sentiment overview by data types including videos
- Sentiment analysis in different languages
- Sentiment overview on different social media channels
Check out this article to see the detailed reports in our sentiment analysis software.
Top Customer Insights Dashboard Applications
Here are some top-performing, intelligent, customer insights dashboard applications, in no particular order. They are apt for specific needs ranging from social media listening and content analysis, to geospatial mapping.
Microsoft’s Power BI is a customizable visualization dashboard that shows you all metrics in a single view. You can build customized scorecards that include advanced filtering, guided navigation, and interactive analytics. More importantly, it keeps your data secure through end-to-end encryption and with security capabilities such as sensitivity labeling and real-time access monitoring. The Power BI also has Power View and Power Map features that support visual data exploration with ad-hoc interactive reporting. It can support geospatial integration with BING maps, Esri ArcGIS maps, and the SQL Server Geospatial engine.
Repustate Sentiment Analysis Dashboard
Repustate’s sentiment analysis dashboard brings your sentiment analysis data to life. You can track named entities, classifications, and entity frequency. The dashboard is agile and swift and keeps up with the sentiment analysis solution’s speed and accuracy, which is the highest against all other leaders in the Magic Quadrant. It is secure - available as an on-premise installation to be behind your firewall, and as a Cloud option. You can review your sentiment overview by data source, country, state, or by region. You can also see the aggregate sentiment scoring on different social media channels. And because all natural language processing is done natively, without translations, you can be assured of accurate results displayed every single time.
Dcipher Analytics is a Scandinavian company that allows you to permute and combine more than 1000 data sources and visualize them all in a single intuitive dashboard. It is used by a large percentage of teachers and academics, as well as market researchers, data scientists, and text analysts. It allows you to interact with your Voice of the Customer or other qualitative data for complex operations through simple user interactions. The sentiment analysis dashboard also allows you insights from images through rapid clustering and annotation. You can also scale quickly, accessing distributed and cloud-computed datasets of all sizes.
Google’s Data Studio is an informative customer insights dashboard that has a flexible template report feature that is apt for the Google suite of products. Anyone can see their data in a graphical format. If you have data in HTML, this dashboard is the best bet for you as you can integrate it into an ecosystem that is capable of reading HTML by just copy-pasting the iframe snippet. There is no need to log into the Data Studio. It is data secure, agile, and simple in design, like all entities of a Google suite. It may, however, not be ideal for traditional database-driven data sources outside the Google set of tools, or if you need to combine data from multiple sources.
Monkeylearn’s sentiment analysis dashboard tags your business data and provides you actionable insights and trends at scale in one data visualization studio. You can create custom visualizations and filter your data by several data inputs. There are multiple in-built templates for data sharing that you can use for your different needs as well. It also allows you to connect to your other business intelligence apps.
Keatext is perfect if you are looking to get insights from your Voice of the Employee data or customer feedback responses. It allows precise insights from large volumes of data across multiple channels. Its AI-powered text analytics platform for customer reviews and conversation data allows you to upload data like reviews, surveys, and support tickets automatically, without manual intervention. Keatext integrates directly with 400 platforms including Zendesk and Intercom.
The Brandwatch dashboard allows you to track and analyze brand mentions in social media from multiple sources. You can monitor and analyze thousands of brand conversations in real-time to know how your marketing and advertising campaigns are performing. You can customize how your data is represented and use filters such as people, categories, and tags, for more targeted insights. The dashboard enables you insights based on your KPIs, sentiments, topics, and opinions through charts and filters for your data and analytics.
IBM Watson Explorer’s sentiment analysis dashboard gives you a guided view based on characteristic words, trends and anomalies, and sentiment and reputation mining. It gives colour-coded scores as positive, negative, and ambivalent. It allows you to organize your data so you can perform lower-level analysis and also export the raw data. It is well-designed, user-friendly, and makes insights from textual data intelligible. It also has extensive compatibility and allows you to retrieve data from multiple sources. Almost all the features are available to use in a free trial.
Semantria Storage and Visualization
Lexalytics’s Semantria Storage and Visualization tool lets you connect to your data sources and allows you to manage and process your text data. You can break down your data by name, date, document count, and also run analyses with existing configurations. This customer insights dashboard is compatible with Excel and gives scoring through colour codes for positive, negative, and neutral sentiments. You can analyze and get a pictorial representation of all your insights from various knowledge bases, all in one place.
ListenFirst is the perfect sentiment analysis dashboard meant for analyzing all the data from Twitter. It allows you to extract and represent Twitter data across owned media, earned media, and competitor insights. You can get a real-time sentiment analysis of conversations and comments on owned posts seamlessly integrated with all your social performance analytics. The dashboard allows you to filter sentiments by product or campaigns on Twitter, and get real-time visualization of what drivers are influencing consumer sentiment.
Agility PR’s Reporting Dashboard acts as a virtual assistant for all your press monitoring involving social media, print, and online news. You can search and share reports with press briefings and reports that can be customized per your needs. You can create executive reports using pre-loaded templates while using real-time data, as well as download individual charts. Built as a self-serving new media reporting tool, the dashboard allows you to share press clippings of vital coverage in automatic media briefings or manually created ones.
Concluding Notes
A sentiment analysis model that can be trained and customized to suit your specific business requirements can be instrumental in driving up your efficiency. And a truly accomplished visualization tool should be able to channelize all this analytical information for business intelligence. It should present historical and real-time patterns and trends in the data, and drown out needless information to avoid redundancy.
 Jeremy Wemple
 Dr. Ayman Abdelazem
 Dr. Salah Alnajem, PhD
 David Allen

 Repustate Team