Home
Home
 Dec 14, 2021

Most Important Customer Experience Dashboard Insights
The customer experience dashboard delivers omnichannel insights from different stages of customer interaction. It highlights the important aspects of a business and how customers feel about them through in-depth customer experience insights. Let’s deep dive and see what these insights are, and how they help brands.
What Is A Customer Experience Dashboard?
A customer experience dashboard gives you all the inputs from a customer’s journey in the sales cycle so that you can use them to better each stage of the journey as needed. This visualization dashboard is the one-stop place for all your customer insights, where through AI-powered machine learning and natural language processing tasks, you can see the sentiment analysis of your voice of the customer data to evaluate consumer trends and take action-backed steps to improve productivity and brand performance.
Furthermore, a visualization board is a critical part of a machine learning platform for consumer experience insights because along with giving you qualitative consumer metrics it also allows you to share them within teams, and compare historical performance with current data to map your growth and customer satisfaction journey.
Learn more about developing your customer experience strategy.
What Insights Does A Customer Experience Dashboard Deliver?
An AI-enabled CX dashboard delivers many important customer experience insights including topic and aspect clustering, entity extraction, breakdown of customer demographics and target audience, categorization and analysis of data formats like video, audio, or text, sentiment analysis, and more. Let’s get to know them more in detail.
1. Omnichannel Insights
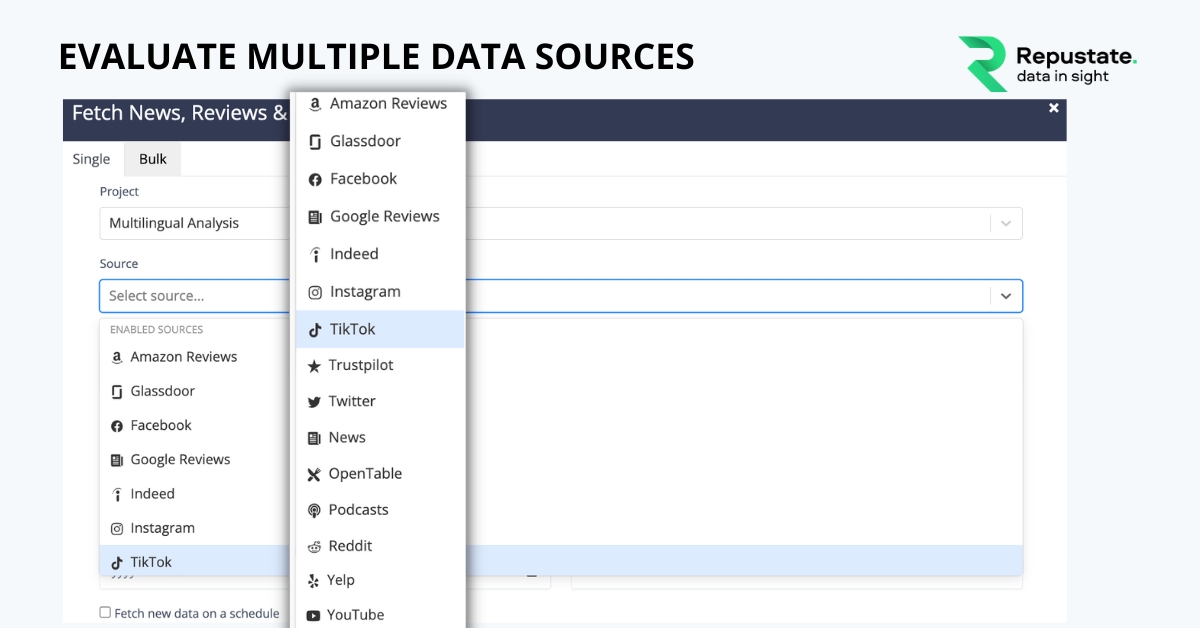
An intelligent customer experience dashboard can give you multi-channel insights all in one place. A single dashboard can give detailed consumer information related to the analysis of surveys, social media listening through access to social channels API’s, as well as news APIs. It can also give sentiment knowledge mapping from live streams, Internal and external communications in organizations, as well as access different types of data formats through sentiment analysis and video content analysis that also includes audio and image recognition and analysis.
2. Topic & Aspect clustering
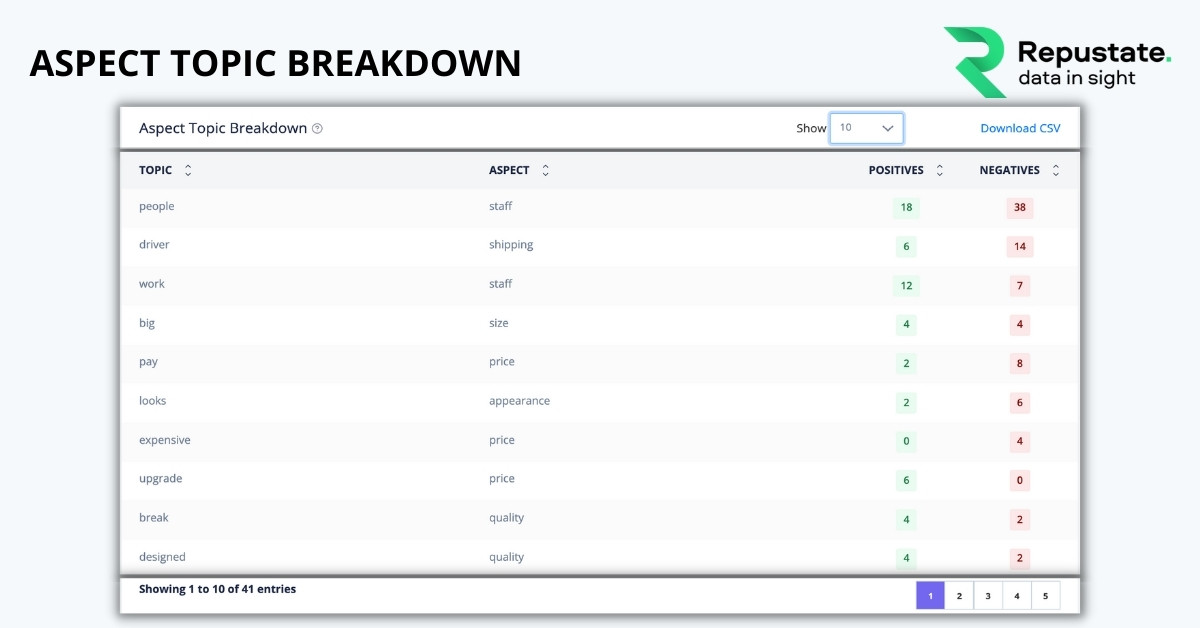
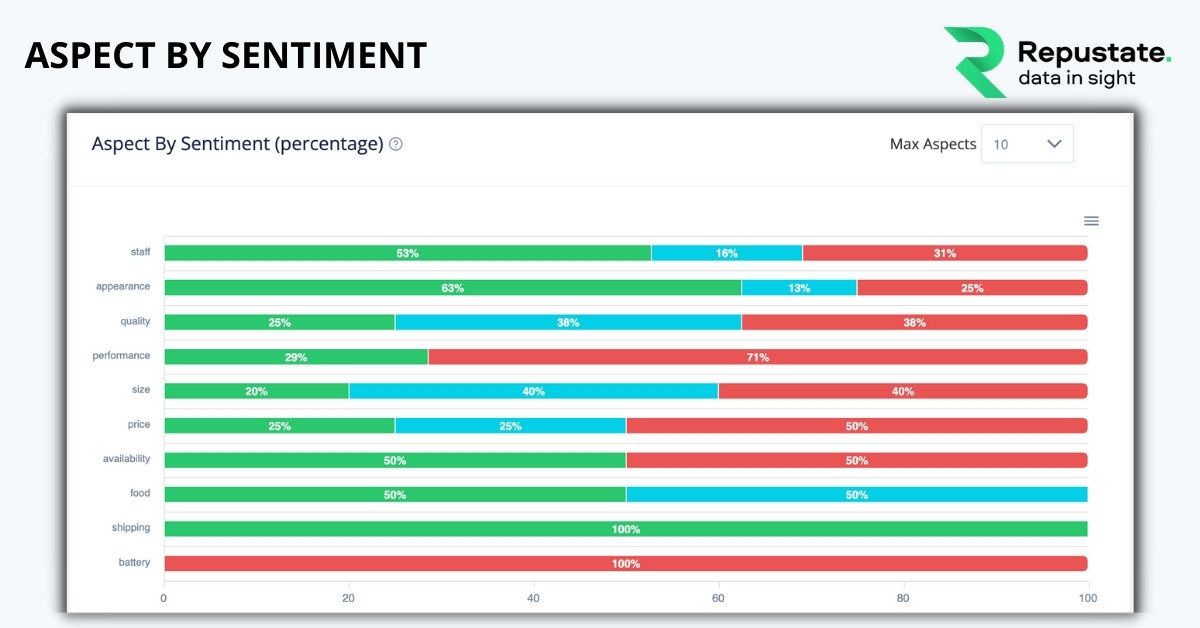
A machine learning platform for customer experience insights will analyze data such that it will, through neural networks, begin recognizing patterns and start clustering topics and aspects that appear in customer feedback data. This includes customer service logs, service complaints, and other historical data that it has analyzed.
Through topic and aspect clustering and analysis, you can begin to see which topics are predominant in which types of product feedback, which aspects begin popping up the most for a specific customer demographic, complaint, or demand. In this way, you can granular details about each of your products, stores, locations, based on customer grouping, brand name, region, likes, dislikes, and other key factors.
3. Sentiment analysis of experience(Net sentiment score)
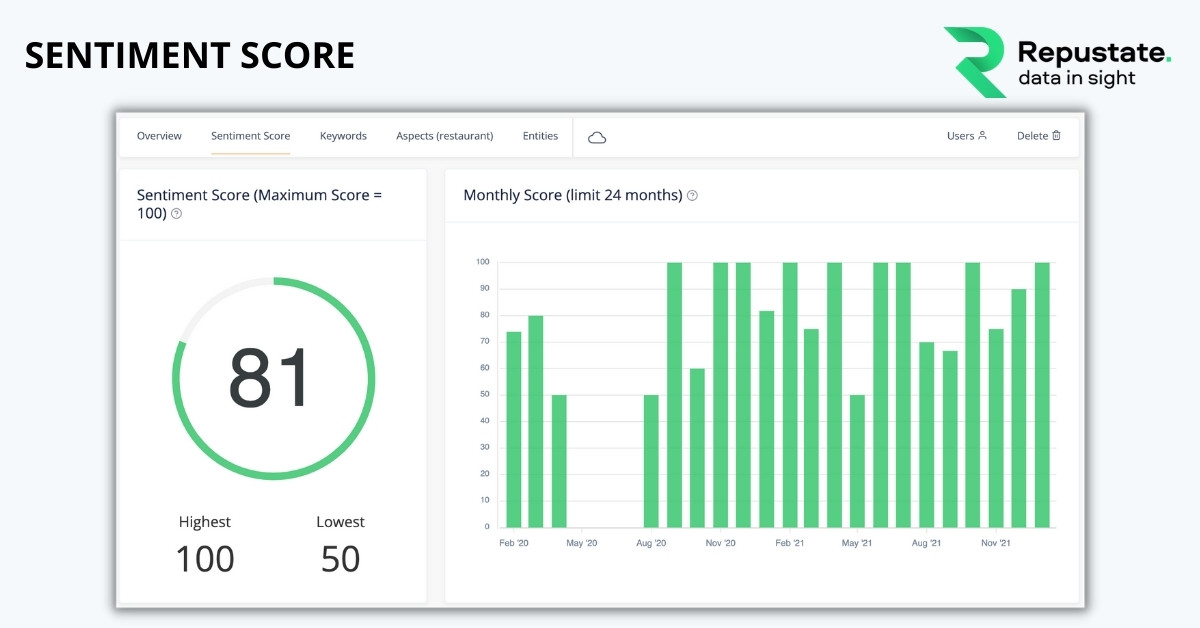
A customer experience dashboard can give you a verifiable, overall sentiment analysis of your brand based on an aggregate of your customer feedback, with current and past data. When a sentiment analysis API examines data, whether, through direct access or a .csv file, it assigns negative, positive, or neutral scores to each text it analyzes. This is usually between scores of -1 to +1. A comment that describes a product as excellent, can be assigned a polarity of +1, while a comment describing a product or service as below average may be assigned a -.05 score.
However, when all these texts or the data in its entirety is analyzed, the machine learning model gives a net sentiment score between 1 and 100, 1 being the lowest, while 100 being the highest. Therefore, an aggregate score closer to 100 means that the brand has a higher positive sentiment amongst consumers, while customer experience insights revealing a net sentiment score of lesser than 50 and closer to the lower digits shows a less than positive sentiment.
4. Topic, aspect & emotional experience co-occurrence
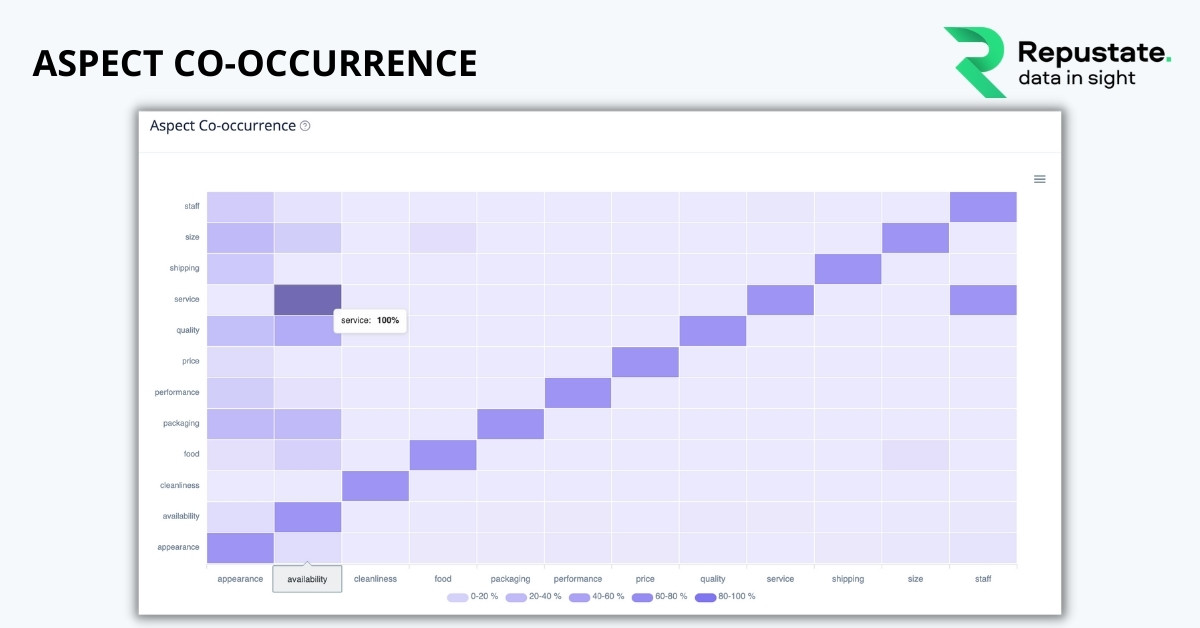
When large amounts of social media listening data, consumer surveys, reviews and comments, user-generated videos, and other voice of the customer information is processed for customer experience insights, a trusted sentiment analysis model extracts all relevant topics and aspects from that data and highlights coinciding customer emotions. This is called aspect-emotion co-occurrence.
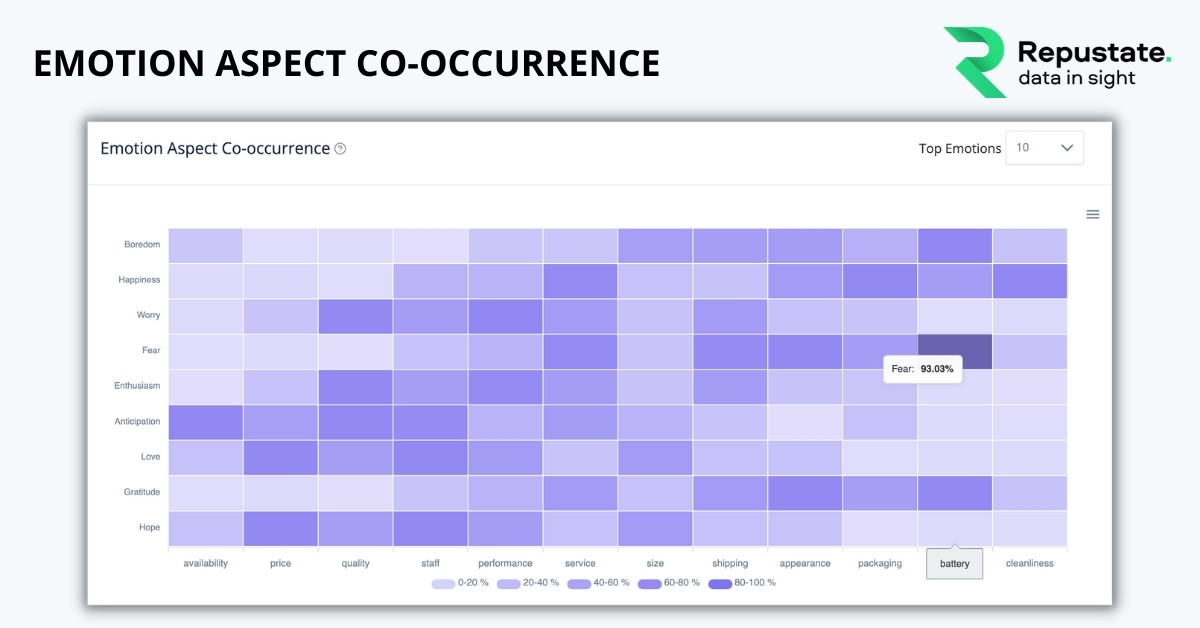
Hovering over the emotion-aspect co-occurrence in the customer experience dashboard can show you what emotions were expressed the most in relation to which aspects. For example, the emotion of “love” was expressed the most with the aspects of “store ambiance” or “product design”. Conversely, it could also show other emotions like “anxiety” and its high occurrence with the aspects of “returns” or “home delivery”, meaning that per the customer experience insights your consumers are likely to buy something in person but reluctant to order anything online because they felt hassled with your customer care department. This is bad news, because online sales and home delivery, and easy returns are almost a norm in this post-covid economy.
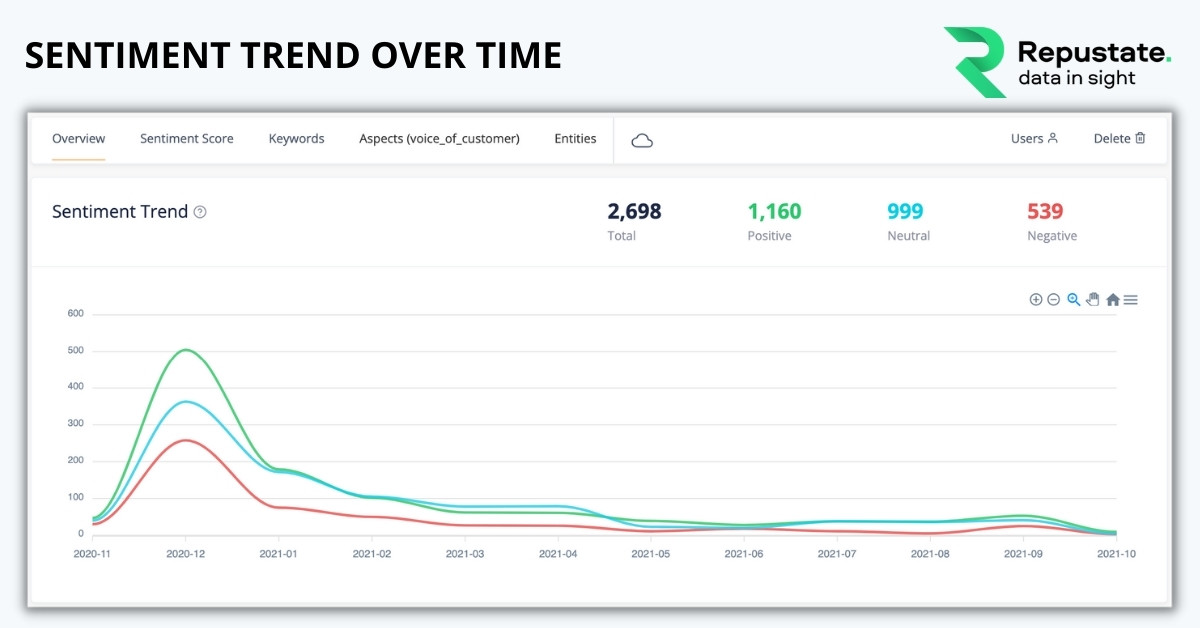
5. Change in experience over time
Customer experience insights can show how satisfaction levels amongst your customers have changed over time. This is possible when the customer experience dashboard analyzes historical data and uses it to map current customer feedback data and extract entities and aspects for emotion mining. Over a period of time, you can see the variations in sentiment data related to different product and service features.
Brands can use this data not only for product and customer experience improvement but also for brand monitoring and reputation management. As CX moved higher on the scale of positive sentiment, brands would know what they are doing right and how they should invest their marketing budget. TikTok insights analysis or YouTube/Facebook comments and video analytics in social media listening, or audio analysis of customer care logs, and even 911 data can tell you important trends related to demographics, geography, seasonal changes, and various other factors over specific periods of time.
6. Named entities, classifications, and entity frequency(Word cloud)
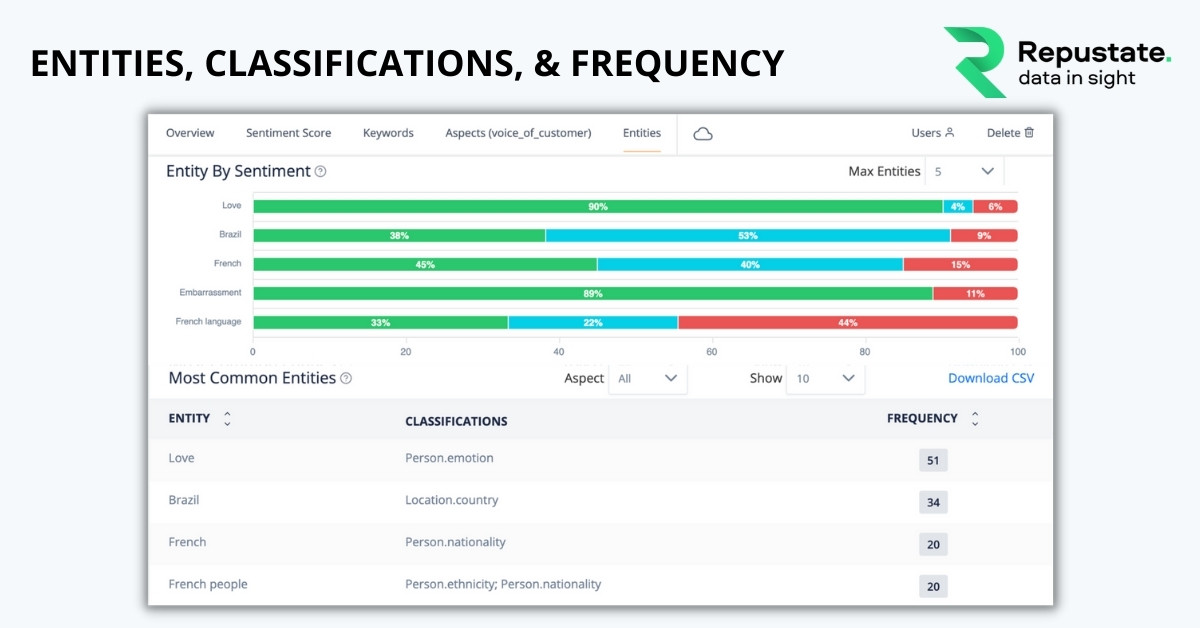
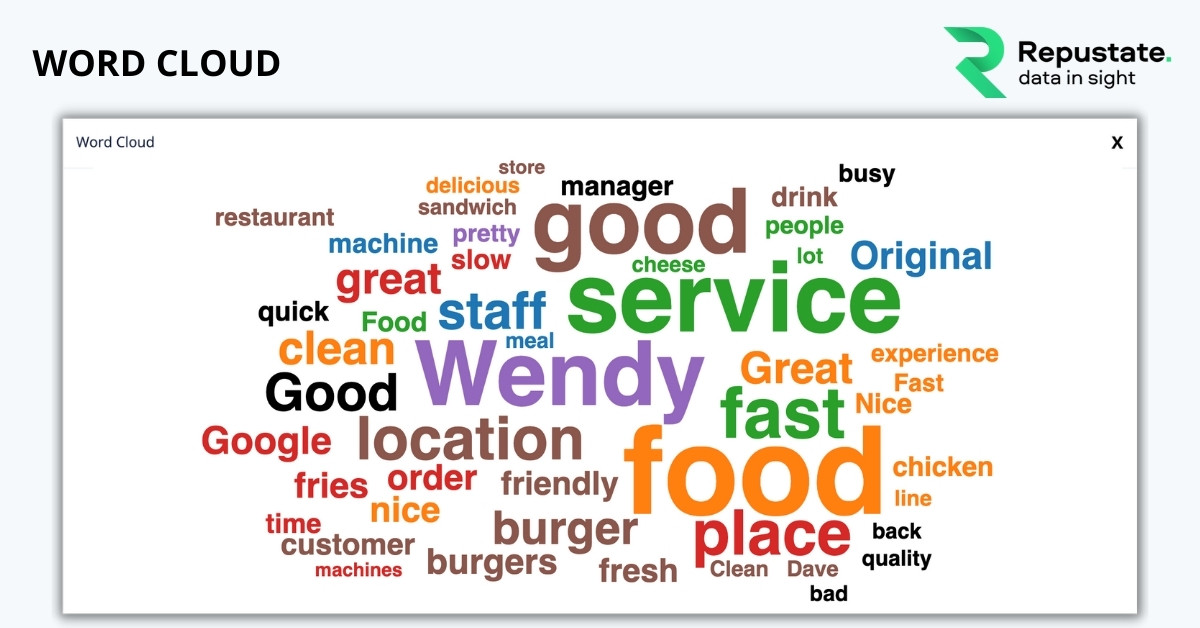
A generous named entity recognition (NER) capability ensures that all entities appearing in a VoC data source are extracted for precision-laden customer experience insights. Entities can be names of people, places, brands, competitors, logos, currency, or any other factor that is specific to the industry the brand is associated with. A customer experience dashboard can showcase all the entities that have been extracted from the data, their classifications, as well as how often those entities have appeared in the data. A simplified image-based word cloud showcases this in an at-a-glance feature on the AI-enabled platform’s intelligent sentiment analysis dashboard.
7. Semantic Search Insights
Understanding the context in which a comment is written is important in order to get accurate customer experience insights. This is possible only if the sentiment analysis platform uses semantics while analyzing text. Using semantic similarity ensures that the platform does not depend only on keywords or NER but understands the reference to those keywords as well. This capability allows the machine learning model to capture the essence of the text and reach the right inference so that you don’t get false positives or negatives. For example, machine learning, through its neural networks that analyze and extrapolate nuances of languages through natural language processing can figure out that if the general theme of the VoC feedback being analyzed is in the context of the hospitality industry, then “a place to hang out” is most probably referring to a cafe or a restaurant, and not a park or a library.
8. Alerts for Media Monitoring
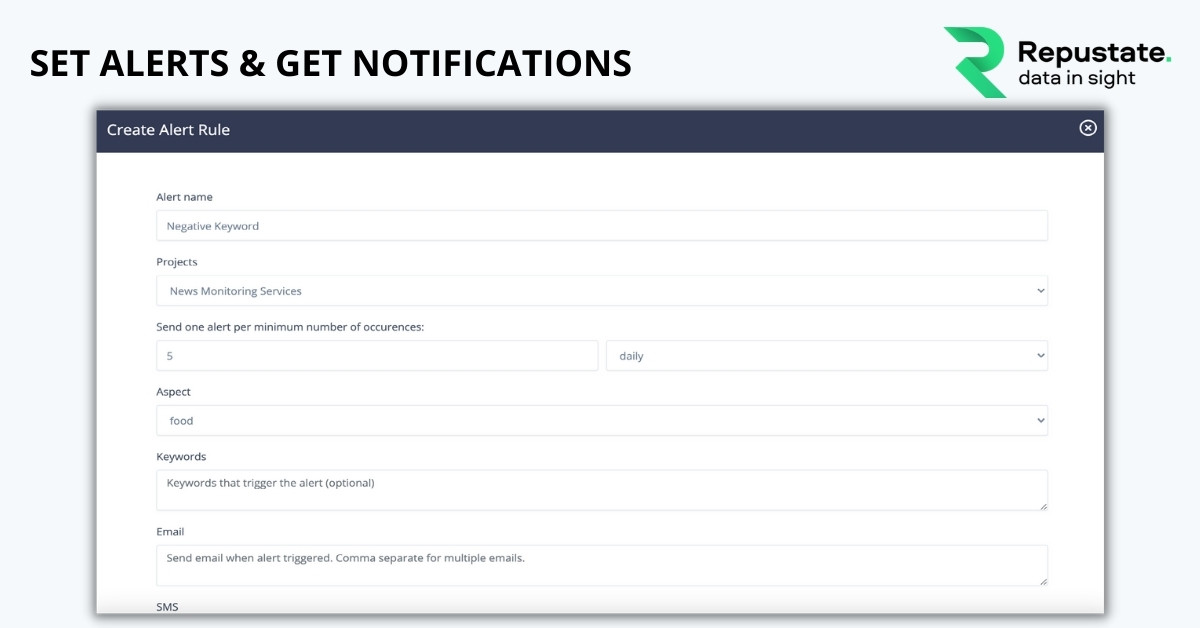
A customer experience dashboard can give you insights on your social media behaviour, that of your audience, and the trends that it can foresee. Apart from qualitative metrics, it can give you all kinds of qualitative information regarding hashtags, user profiles, and brand and entity mentions. Regular social listening tools can give you numbers in the name of customer experience insights, which would look good in a meeting but what marketing teams really need is to know what caused those numbers to be such. If your brand mentions are high, or your videos shared x number of times, the high number may seem like a positive thing but when it doesn’t necessarily lead to an exponential increase in sales numbers, it hints to the fact that there can be more than one reason why social metrics are high but don’t translate to growth in revenue.
These reasons can be discovered through sentiment analysis of hashtags and through video AI-enabled search inside video capabilities that can highlight the many different aspects of why a particular campaign went viral but didn’t really do anything spectacular for sales. Read how Repustate analyzed the McDonald’s video to show this aspect.
9. Multilingual analytics
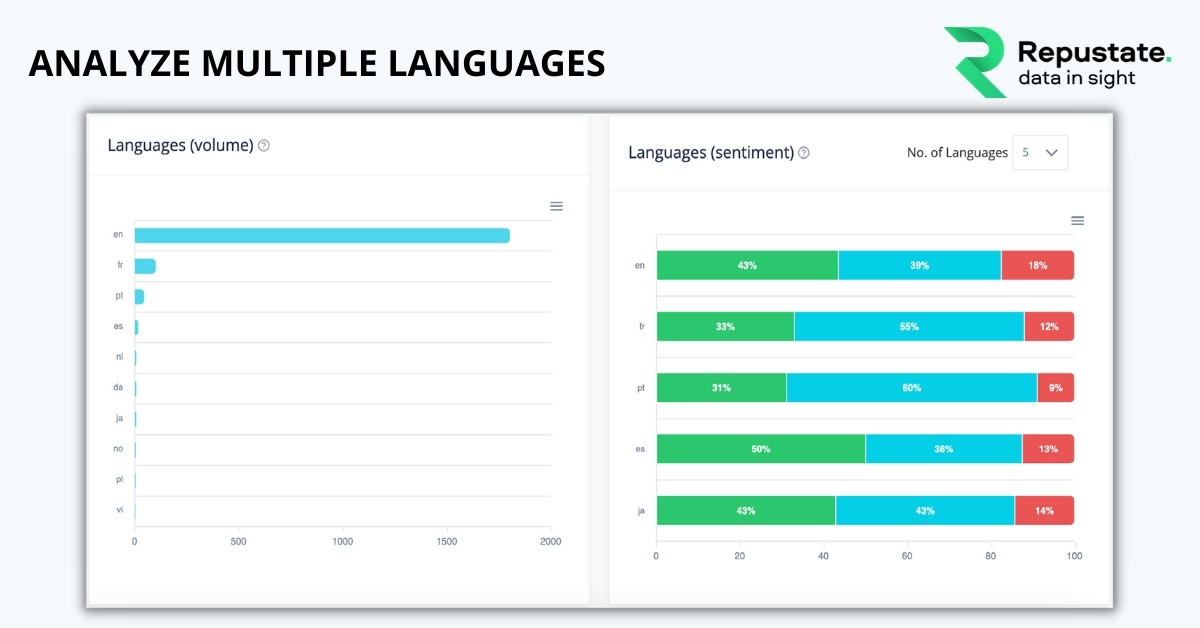
You can get customer experience feedback in any language depending on the platform the customer is using. Brands don’t necessarily have to be internationally located to receive data in multiple languages, especially in countries with heterogeneous crowds. Similarly, when it comes to news monitoring, it makes sense to gather intelligent data from all sources of news even if they may be in a different language than what your core marketing team is comfortable with.
This is possible with a customer experience dashboard that has a multilingual analytics capability. But more importantly, one that uses native reading to understand the data rather than relying on translations which traditional sentiment analysis and consumer insights models do. Having a dedicated speech tagger is very important for such functionality because that is what separates it from models that can read multiple languages but cannot give optimum results. Repustate offers seamless multilingual analytics for customer experience insights in 23 languages, all of which are extracted natively. It is because of this enriched capability that it was able to add the Chinese short video app Douyin to its already vast list of data sources that includes TikTok, YouTube, Google reviews, and more. Read the press release.
10. Social media listening
Businesses can obtain the most thorough customer experience analysis through social listening. A clever sentiment analysis platform can do this either by:
-
Accessing live APIs of social media websites like Facebook, from where it can gather all relevant information that is publicly available. This includes memes, news, videos, images, comments, posts, podcasts, and other content that is not private.
-
The other way that you can do it is by submitting the direct source URL of the video you want to access, or downloading the social data and uploading it onto the platform as a .csv file.
11. Demographic breakdown
A customer experience dashboard can give you the breakdown of your target audience depending on aspects and features and their corresponding sentiment. You can get this information based on current data or historical ones. This information is very important while analyzing marketing campaigns to see which product features or service aspects resonated the most with which demography. You can use this information for future promotions, campaigns, or advertising strategies.
Similarly, audience demographics can also be found out through analyzing user profiles on social media or other online platforms. You would know what was common between users who liked similar activities, places, or things apart from your product/service. This allows you to create a buyer persona, which in return helps in developing a more targeted marketing angle.
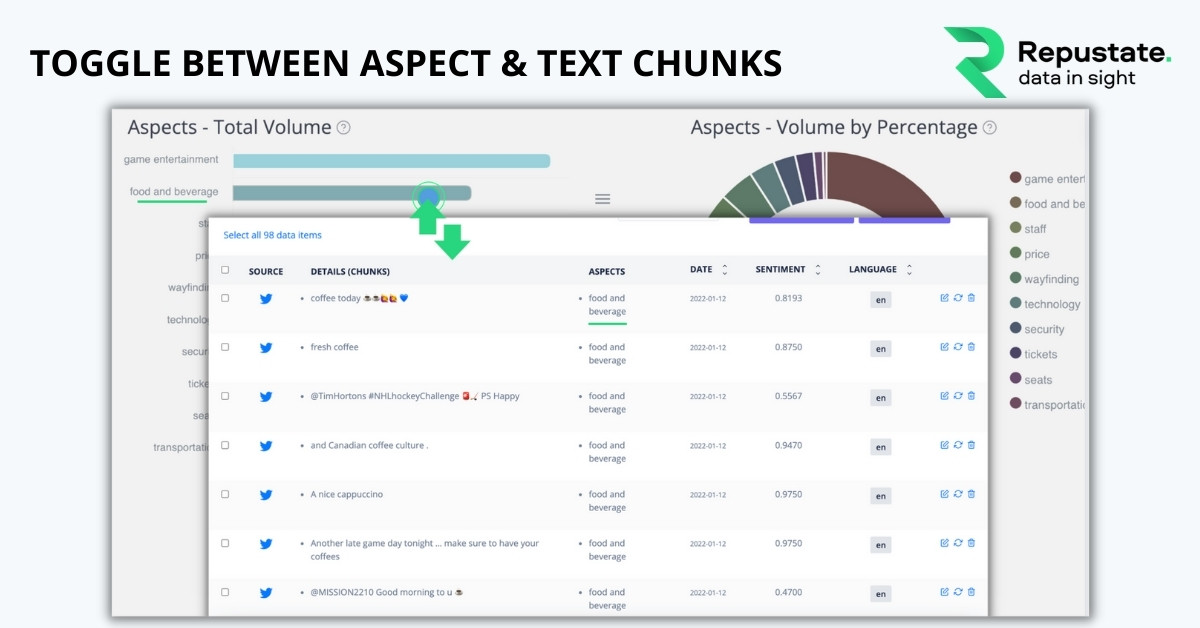
12. Segregation of Text, Audio & Video Analytics
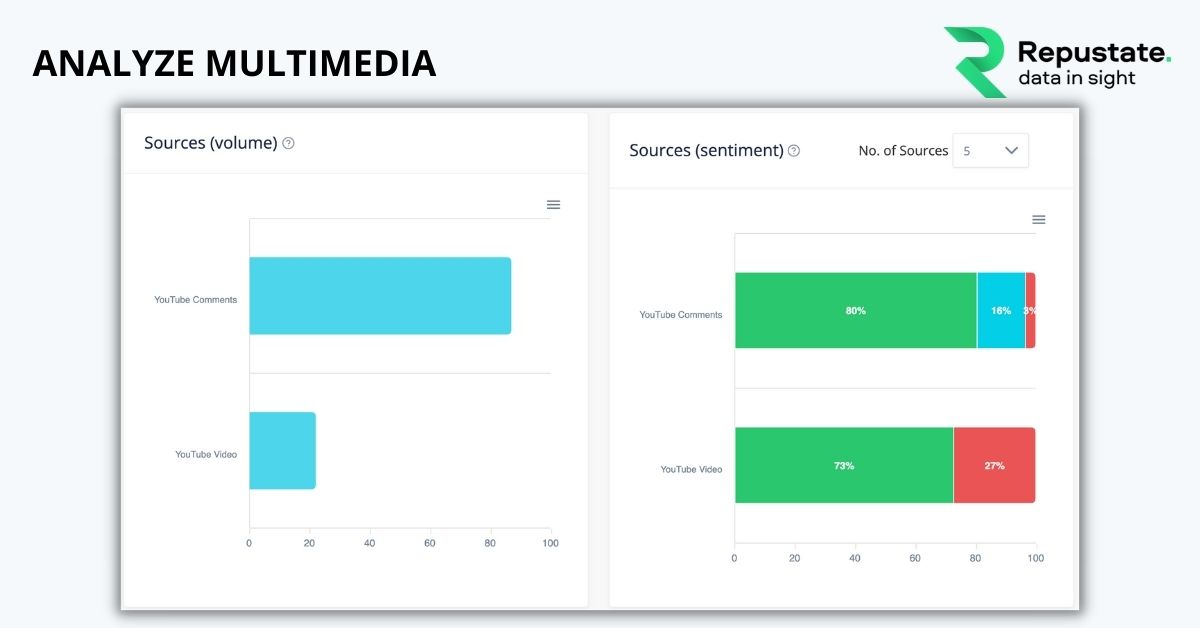
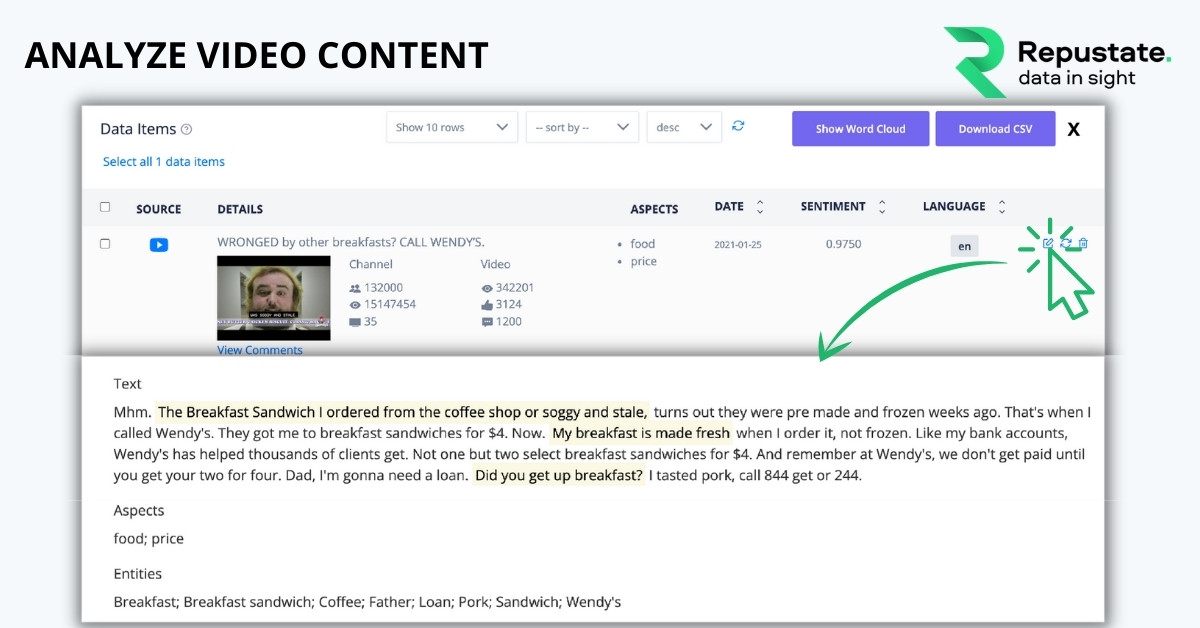
Customer experience insights with the help of a CX dashboard can be extracted for any kind of content that has been generated for your product or service - text, audio, or video. This capability is invaluable for an enterprise, which in itself has a vast amount of big data that consists of training videos, presentations, marketing and sales collateral, office emails, content repositories, etc. Similarly, when it comes to analyzing TikTok viral videos, Facebook or IGTV videos, or reviews on YouTube, video content analysis becomes key in understanding not only the context and intent of the video but also subliminal messages that can be sent using your brand. This is very helpful in making sure that your brand is not being used without consent on ideologies your brand does not adhere to, or using your content or logo without your consent.
Conclusion
An AI-enabled customer experience dashboard can lead to better productivity and efficiency, all linked to data-backed information that you can use for future growth plans to increase your ROI.
 Jeremy Wemple
 Dr. Ayman Abdelazem
 Dr. Salah Alnajem, PhD
 David Allen
 Repustate Team